ST. LOUIS — Thinking about hosting a Thanksgiving feast, going to a “friendsgiving” gathering or traveling out of town for the holiday?
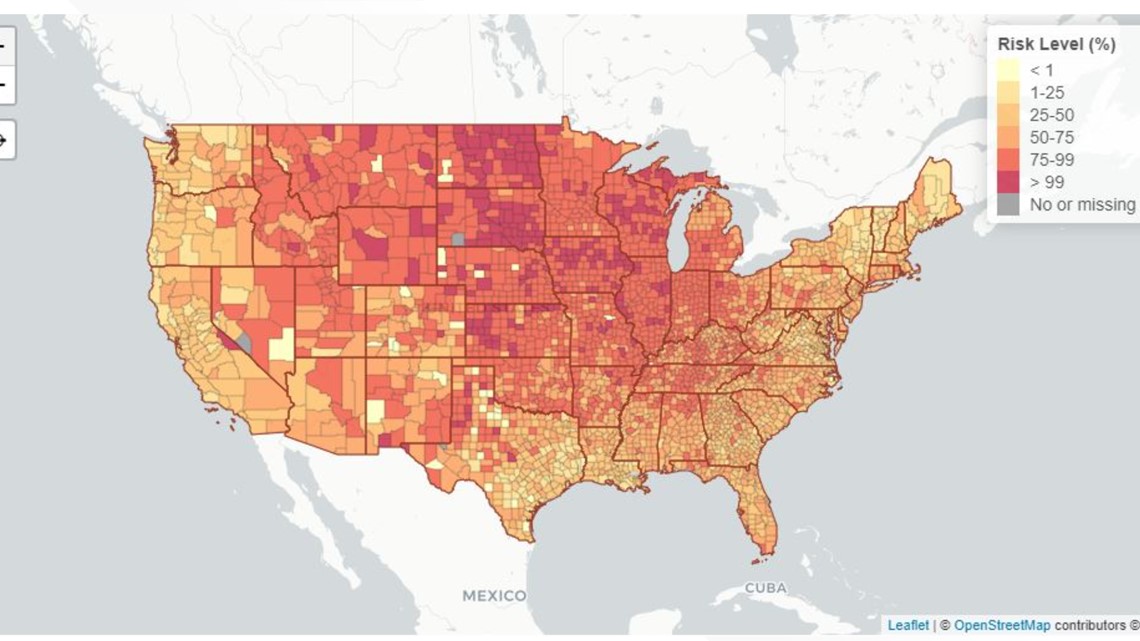
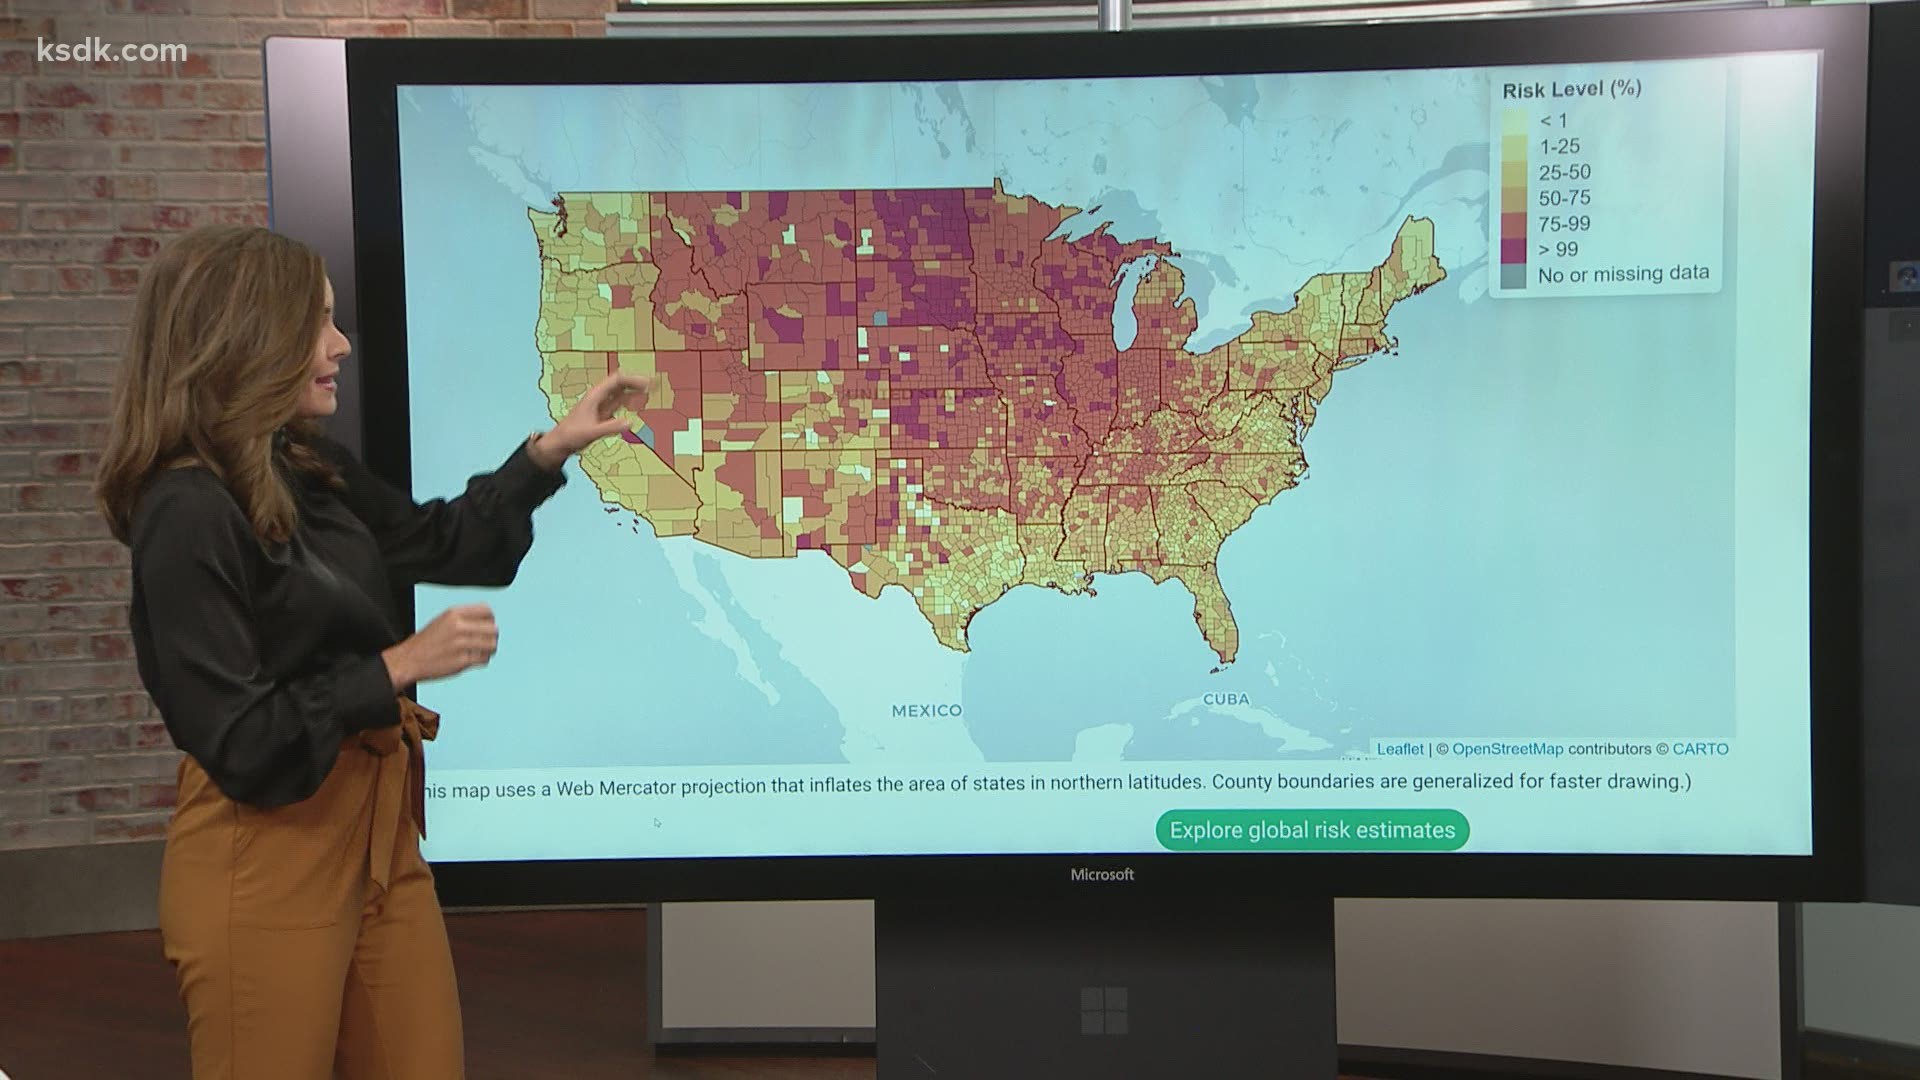
An interactive map can help determine how likely you are to come across COVID-19 if you’re planning on being around a group of people this holiday season.
The COVID-19 Event Risk Assessment Planning Tool is put together by a team of researchers and professors at the Georgia Institute of Technology, Applied Bioinformatics Laboratory and Stanford University.
The interactive tool breaks down the risk level of at least one person with COVID-19 being at an event, with the crowd size ranging from 10 people to 5,000. The bigger the crowd, the bigger the risk.
For example, here’s how likely it is that there will be at least one COVID-19-positive person at gatherings of various sizes in St. Louis County, Missouri:
- 10 people: 25%
- 15 people: 35%
- 25 people: 51%
- 50 people: 76%
- 100 people: 94%
- 500 people: >99%
The map includes data for every county in the U.S.
You can explore the map and its vast data for yourself on the Georgia Institute of Technology’s website.


The U.S. set a new record Thursday, surpassing 150,000 new cases for the first time ever. In addition to the 153,496 new cases, according to Johns Hopkins University, the 7-day average ending Thursday was 131,455. In the seven days prior to that, the average was 94,340.
About 1,000 people per day have died in that same 7-day span. It was an average of 887 for the seven days prior.
The Associated Press contributed to this story.

