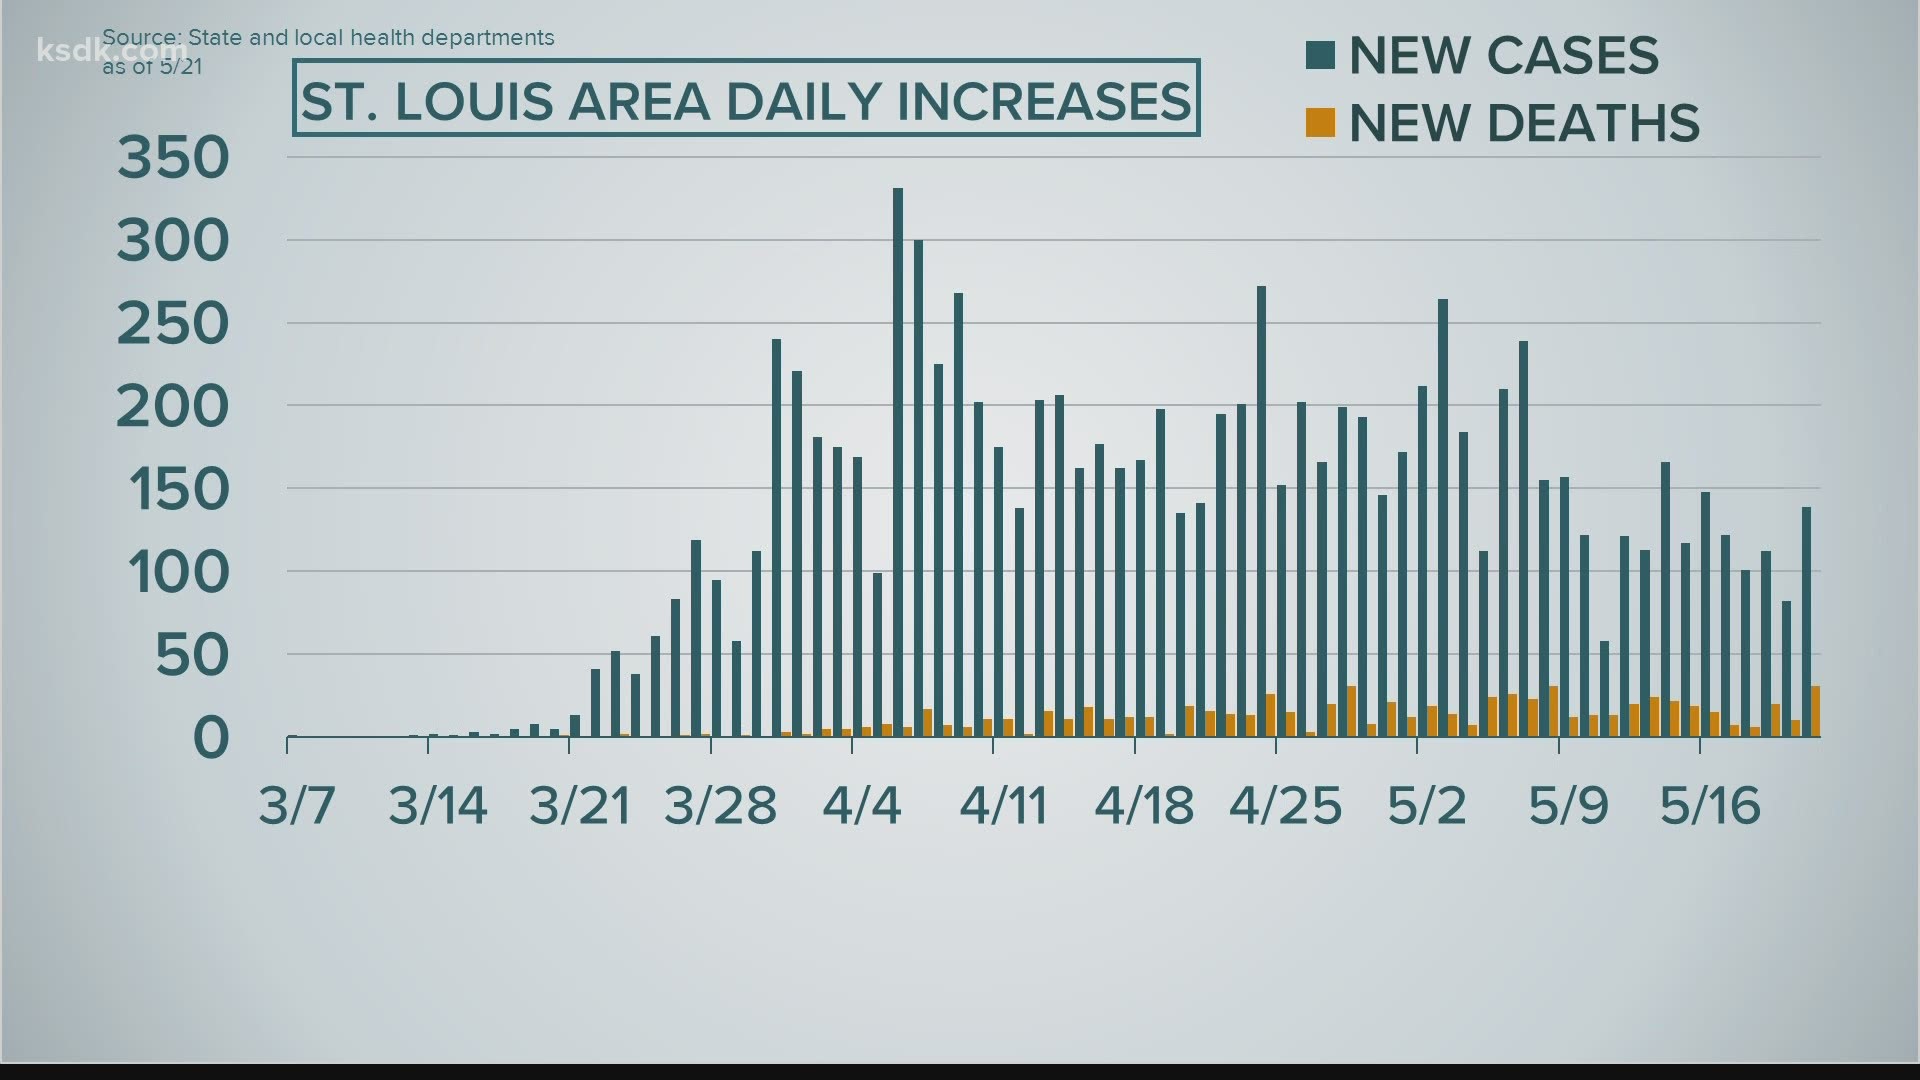
JEFFERSON CITY, Mo. — The Missouri Department of Health and Senior Services reported more than 200 new COVID-19 cases for the first time since Saturday. This came the day after the state reported the lowest number of new cases in a week.
The department reported a total of 11,558 cases and 671 deaths Friday, which was an increase of 218 cases and 10 deaths.
The single-day increases reported by the DHSS over the last week were:
- 108 on Thursday
- 152 on Wednesday
- 135 on Tuesday
- 156 on Monday
- 114 on Sunday
- 219 on Saturday
The health department has not updated its total of new tests conducted as of 10:45 p.m. Friday. The state’s number stands at 172,946. On Thursday, Missouri reported 10,962 new tests, which was the highest single-day increase during the pandemic.
As of Thursday, the percent of tests coming back positive in Missouri — also known as the positivity rate — was 6.74%, the lowest it's been since April 2. That number can represent an increase in testing capacity, a decrease in the spread of the virus or both.
The state’s count did not include six deaths and about 312 cases reported by locak health departments in the St. Louis area, bringing the total in the state to 11,870 cases and 677 deaths. Local health departments have more up-to-date information about their area, so the numbers are typically higher than the state's numbers.
St. Louis and St. Louis County are the top two areas in terms of cases and deaths, but other counties have higher rates per 100,000 people. St. Louis has the highest rate in our area with 546 cases per 100,000, but Saline County (1,135 per 100,000), Buchanan County (676 per 100,000) and Sullivan County (626 per 100,000) all have higher rates. St. Louis County has the fifth-highest rate, 438 cases per 100,000.
The age breakdown for state-reported cases as of Friday was:
- Under 20 426
- 20-24 695
- 25-29 849
- 30-34 797
- 35-39 778
- 40-44 808
- 45-49 930
- 50-54 971
- 55-59 1,045
- 60-64 1,013
- 65-69 772
- 70-74 630
- 75-79 496
- 80+ 1,340
The age breakdown for state-reported deaths as of Friday was:
- Under 20 0
- 20-29 1
- 30-39 4
- 40-49 13
- 50-59 43
- 60-69 112
- 70-79 175
- 80+ 323
For a full county-by-county breakdown, including per 100,000 data, use our interactive map:

