MISSOURI, USA — The Missouri Department of Health and Senior Services reported an increase of 201 COVID-19 cases Wednesday, the third time in the last week the state has reported more then 200 new cases.
The department reported a total of 12,492 cases and 696 deaths Wednesday, an increase of 201 cases and 10 deaths. The state also reported an increase of 5,191 new PCR tests, bringing the state's total to 165,304.
The single-day case increases over the last week were:
- 124 on Tuesday
- 179 on Monday
- 236 on Sunday
- 194 on Saturday
- 218 on Friday
- 108 on Thursday
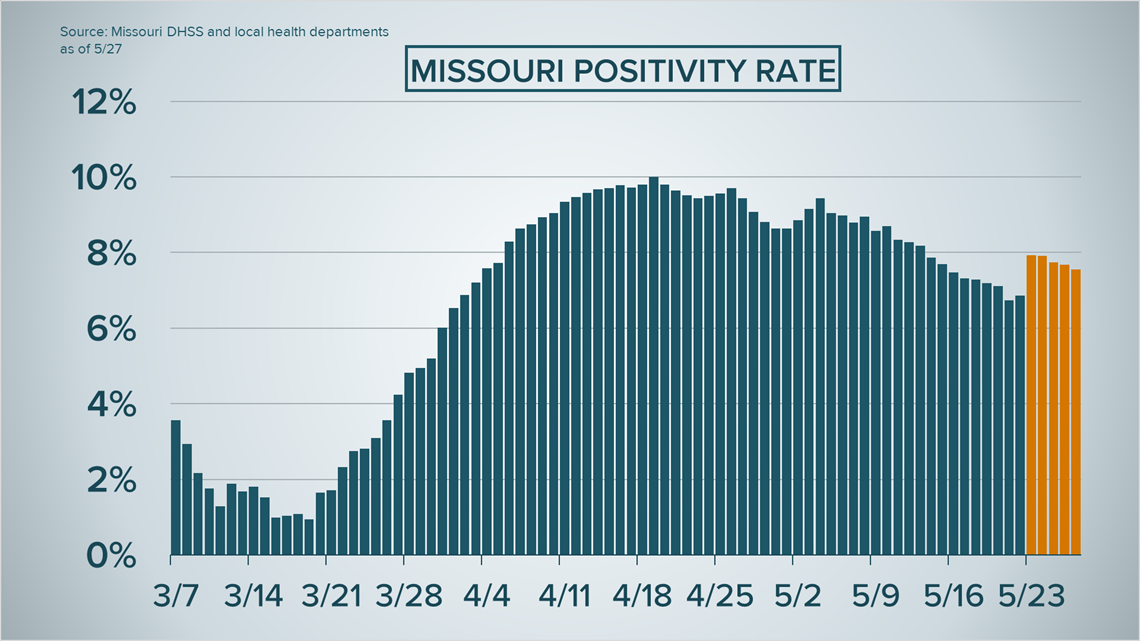
The positivity rate in the state decreased to 7.56% Tuesday, down from 7.68% on Monday. The rate has dropped each day since the state made changes to the way it reports testing data.
RELATED: Missouri health department reports 1 new death as director takes questions on reporting change


The Missouri DHSS COVID-19 count did not include about 300 cases and four deaths reported by St. Louis area health departments, bringing the totals to 12,809 cases and 700 deaths in the state. Local health departments typically have more up-to-date information than the state. Five of the deaths reported by the Missouri DHSS Wednesday were previously reported by St. Louis area health departments.
St. Louis and St. Louis County account for more than half of the cases and deaths in the state. St. Louis County has the highest number of cases(4,832) and deaths(389) of any county in the state, but St. Louis city has a higher rate of cases.
St. Louis has the highest rate of COVID-19 in the area with 626 per 100,000, but there are three counties in the state with higher rates. Saline County has the highest with 1,173 per 100,000 followed by Sullivan at 870 and Buchanan with 757.
The age breakdown for state-reported cases as of Wednesday was:
- Under 20 481
- 20-24 773
- 25-29 948
- 30-34 881
- 35-39 856
- 40-44 871
- 45-49 995
- 50-54 1037
- 55-59 1104
- 60-64 1063
- 65-69 815
- 70-74 676
- 75-79 526
- 80+ 1426
The age breakdown for state-reported deaths as of Wednesday was:
- Under 20 0
- 20-29 1
- 30-39 4
- 40-49 13
- 50-59 44
- 60-69 117
- 70-79 183
- 80+ 334
For a full county-by-county breakdown, use the interactive map below:

